
Gaussian splatting at city scale: how a whole city fits in one viewer
At the end of October 2026, the American company Cr3ate published a flight over Graz, in Austria: 1.1 billion Gaussian splats covering about 7 km² of the city, reconstructed from 700 aerial images taken by a Vexcel UltraCam Dragon at a resolution of 2 cm per pixel. The flight ends at the foot of the Lichtschwert, a steel Statue of Liberty in front of the opera house.
The figures are the company’s own, and nobody has checked them independently yet. But they mark a change in scale. The previous articles in this series dealt with an object, a room, a building, a street. A city is a different problem. It is about a thousand times bigger, it has to be photographed from an aircraft, it produces files no phone could open, and it is shown only one fragment at a time.
A city in numbers
From an object to a town
- A potted cactus 139.4K splats · one object, the scene of the first article in this series
- Microsoft’s Redmond campus 110M splats · 3.7 km², drone photos — Cesium and Bentley, April 2026
- Graz, Austria 1.1B splats · about 7 km², survey aircraft — Cr3ate, October 2026 (vendor figure)
- Minning Town 6.2B splats · 23.5 km², aerial and ground — XGRIDS, October 2026 (vendor figure)
What a phone draws per frame (about 1 million)What a computer draws per frame (about 2.5 million)
Four real Gaussian splatting scenes on a logarithmic scale from 100 thousand to 10 billion splats: a potted cactus, 139,410 splats; Microsoft’s Redmond campus, 110 million; about 7 km² of Graz, 1.1 billion; a 23.5 km² town, 6.2 billion. Two lines mark what a phone (about 1 million) and a computer (about 2.5 million) draw in one frame.
The bars use a logarithmic scale: each tick is ten times the previous one. Graz holds 440 times what a computer draws in a frame, and 1,100 times what a phone draws. Sources: Cesium’s blog for Redmond, Cr3ate and XGRIDS for their own scenes.
From the cactus in our first article to Graz, there is a factor of 8,000. The Graz capture is still only 5.5 % of the city, whose territory covers 127.6 km². And XGRIDS announced a 23.5 km² town in 6.2 billion splats a fortnight earlier, captured from the air and the ground for a documentary.
XGRIDS showing, in October 2026, a 23.5 km² town reconstructed as 6.2 billion splats from aerial and ground captures for a film production — a vendor figure.
Video: XGRIDS, on YouTube.How a viewer shows a billion splats
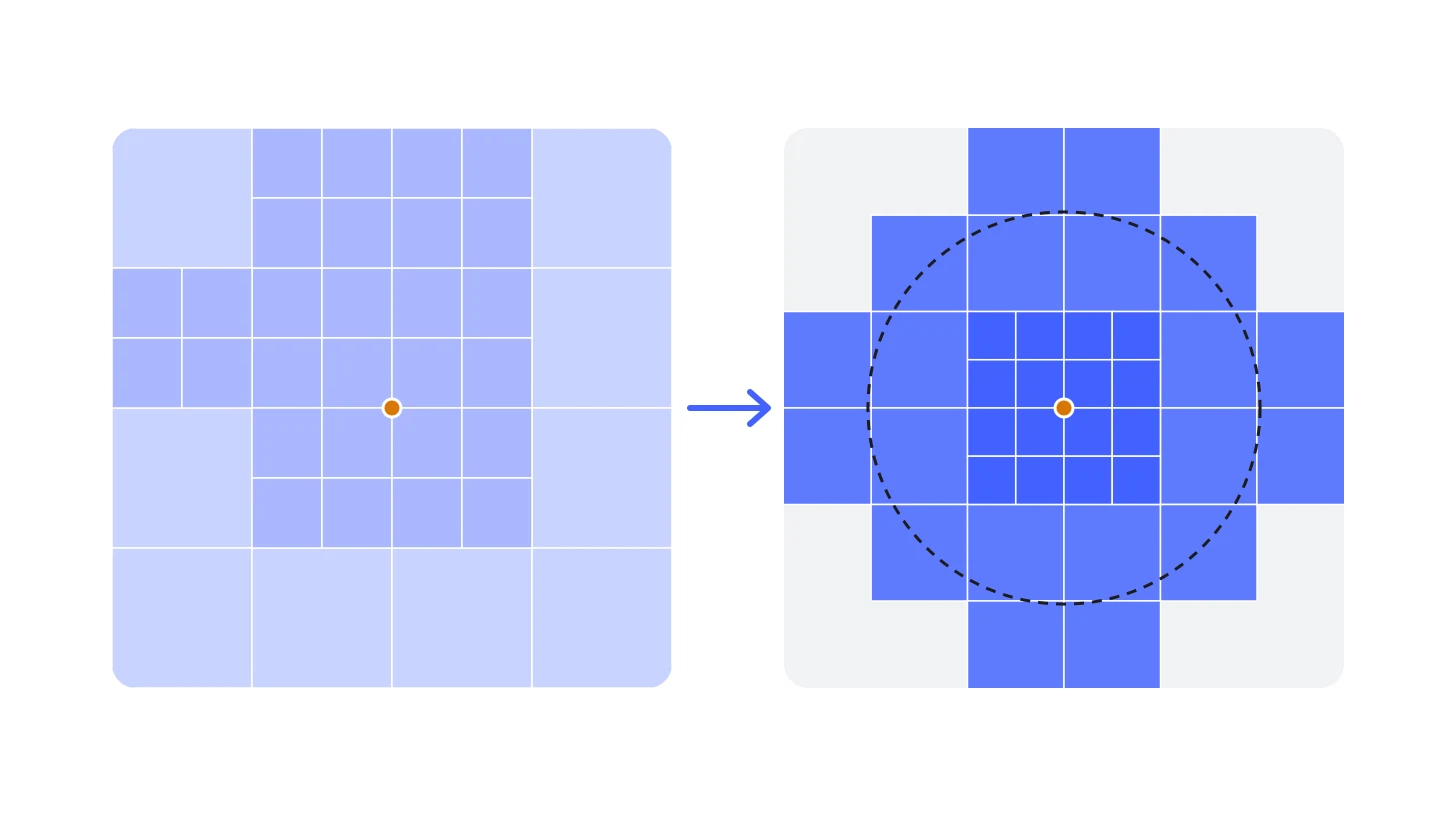
The answer is short: it never does. A phone draws about a million splats per frame, a computer two to four million. A city is therefore cut into tiles, each kept at several levels of detail. The viewer only loads the tiles the camera sees: up close at full resolution, further away in a coarser version made of fewer, larger splats.
From the street to the whole city
- Ground in view
- 1.42 km²
- Tiles loaded
- 36
- Splats drawn
- 2.4M
- Share of the 1.1 billion
- 0.21%
- Smallest tile
- 165 m
coarse tile full detail
A 7 km² city seen from above, cut into the tiles a streaming viewer loads. As the camera rises from 40 metres to 2,500 metres, the area in view grows from a street to the whole capture, the tiles get coarser, and the number of splats drawn stays at about 2.4 million — less than a quarter of one percent of the 1.1 billion.
A simplified model of what Cesium’s 3D Tiles, PlayCanvas’s Streamed SOG and Spark’s .RAD do: each tile holds about 65,000 splats, and the viewer keeps splitting the tile that looks biggest on screen until the frame budget — here 2.5 million splats — is spent.
The method comes from research. Inria, which invented Gaussian splatting, presented a hierarchy of Gaussians for very large scenes at SIGGRAPH 2024: the scene is trained in independent chunks, then merged into a tree whose levels the viewer crosses as the camera moves.
Inria presenting its hierarchical Gaussians in 2024: scenes of tens of thousands of photos, shown in real time by crossing a tree of levels of detail.
Video: Inria GraphDeco, on YouTube.Two years later, it is in the tools:
- Cesium streams splats as 3D Tiles. The tiles carry glTF files with the
KHR_gaussian_splattingextension, now ratified by the Khronos Group, compressed with SPZ. - PlayCanvas cuts a scene into a tree in which each level halves the number of Gaussians. It draws at most 2 to 4 million on a computer and 1 to 2 million on a phone.
- Spark, World Labs’ library, states that its paged format lets “scenes with 100 M or 1 G+ splats” run in real time on mobile devices. Judging from its website’s code, Cr3ate’s viewer is built on it.
The capture: an aircraft, and a lot of pixels
A drone covers a site. A city needs an aircraft. The Vexcel UltraCam Dragon used for Graz is a survey camera mounted under a plane. It combines a vertical camera, four oblique cameras and a LiDAR scanner, and takes 243 megapixel photos every 0.7 seconds — Cr3ate rounds this to 250. Its brochure gives 2 cm per pixel at 362 metres above the ground.
What a city capture weighs
- Flying height
- 362 m
- One photo covers
- 383 × 255 m
- Camera positions
- 1,033
- Vertical photos
- 252 gigapixels
- Raw images, all cameras
- 3.6 TB
- Splats (estimate)
- 468.2M – 1.1B
- Raw splat file (PLY)
- 116 GB – 273 GB
- Compressed for the web (SOG)
- 6 GB – 18 GB
- Drawn per frame on a computer
- 0.23% – 0.53%
For a Vexcel UltraCam Dragon 4.2 (19,136 × 12,736 pixels per photo) at 80 % forward and 60 % side overlap, plus 15 % for the edges. The splat range runs from the density of Cesium’s Redmond campus to that of Cr3ate’s Graz, scaled to the resolution; the real count depends on how the scene is trained. Cr3ate reports 700 images for Graz; this model gives about 1,000 camera positions.
For an area from 0.1 km² to all of Graz and a ground resolution from 2 to 10 cm, the flying height of a Vexcel UltraCam Dragon, the footprint of one photo, the number of camera positions, the pixels and raw data, then an estimated splat count and the size of the files, raw and compressed for the web.
An order of magnitude, not a quote. At 2 cm, a district of 1 km² already needs about 150 camera positions; all of Graz, at 5 cm, about 3,000. Formulas and sources are in the code of the figure.
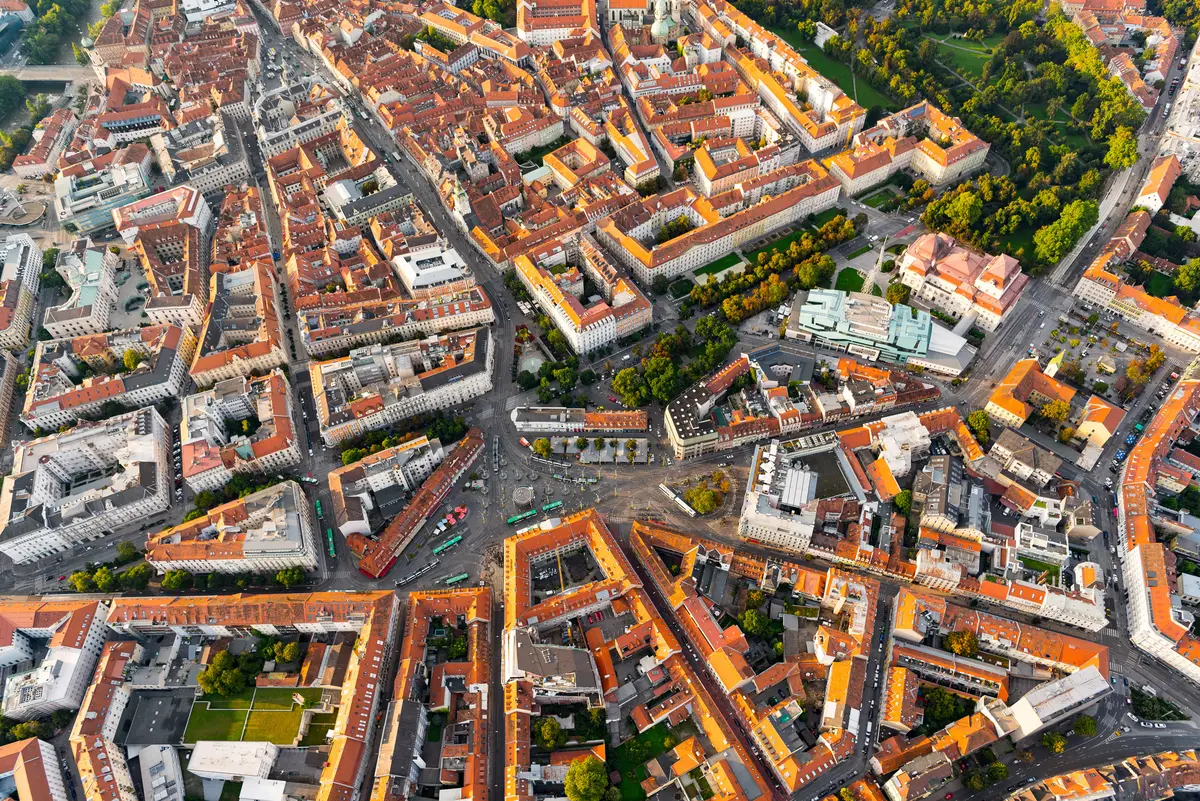
Graz seen from above, the kind of view an aerial survey records — here Jakominiplatz and the old town. Roofs and squares are well covered; the façades, much less.
Image: holding graz, CC BY 2.0, via Wikimedia Commons (resized, converted to WebP).Other teams publish comparable workflows. In Tallinn, the surveyors IGI, Bentley and Terrasolid flew the historic centre at 2 cm with a camera of the same kind, about 1,700 images. According to Terrasolid, turning them into splats took 18 hours in Bentley’s cloud, against about six days on a single workstation. Microsoft’s Redmond campus, for Cesium, comes from 20,169 drone photos, 428 gigapixels in all.
And the camera manufacturer itself is changing hands. On 29 October 2026, Vexcel announced that it is joining CoStar Group, the American owner of Apartments.com. Aerial imagery is becoming a real estate asset.
Who does it in 2026
- Cr3ate: a single pipeline that produces a mesh, a point cloud and splats in the same coordinates, from drone, phone, 360° or aircraft images.
- Moving objects such as people and cars are removed automatically, according to its profile.
- The company sells a desktop application, a cloud service, and an offer that turns a street address into 3D using aerial imagery from its partner Vexcel. Its free tier is for non-commercial use only.
- Cesium and Bentley: splats as map layers, in the browser and in Unreal, produced by iTwin Capture.
- Esri: splat layers in ArcGIS, fed by multi-camera aircraft or drones.
- XGRIDS: handheld scanners and drones, then Unreal Engine for film.
- Research: CityGaussian noted in 2024 that a 24 GB graphics card runs out of memory beyond about 11 million Gaussians. In 2026, BlitzGS trains a city in tens of minutes on four graphics cards.
The limits
- The viewpoint. An aircraft sees roofs and, with oblique cameras, façades from afar, but not the street. Pix4D warns that quality “can degrade significantly away from” the photographed viewpoints. For anything seen at eye level, aerial capture has to be completed from the ground, as described in the article on terrestrial and aerial capture.
- Analysis. A splat is made to be looked at, not measured. Esri does not allow visibility analyses on its splat layers, and a single splat cannot be selected.
- Time. A splat is a snapshot of one flight: building sites, seasons and shop fronts change, and a new capture means a new flight.
- The law. In France, aerial imaging is forbidden over listed sensitive sites without a derogation (the ZICAD zones). At 2 cm per pixel, faces and number plates can be personal data under the GDPR, so blurring and the rights to aerial imagery must be settled before anything is published.
What a city, or a brand, can do with it
Tourism got there first. For Expo 2025 in Osaka, Visit Linz and Ars Electronica built “Beyond Curiosity”, a tour of Linz assembled from more than 200 splats, from the main square to the banks of the Danube. Residents can add their own scans made on a phone.
Visit Linz presenting “Beyond Curiosity” in April 2025: the city, its squares and its riverbanks visited as Gaussian splats.
Video: Visit Linz, on YouTube.The other uses follow the same logic:
- Real estate: a new development shown in its real neighbourhood.
- Events: an event site visited before the day, for visitors or exhibitors.
- Urban planning: a project placed in its street before the planning permission.
- Film: a town captured once, then filmed from any angle in Unreal.
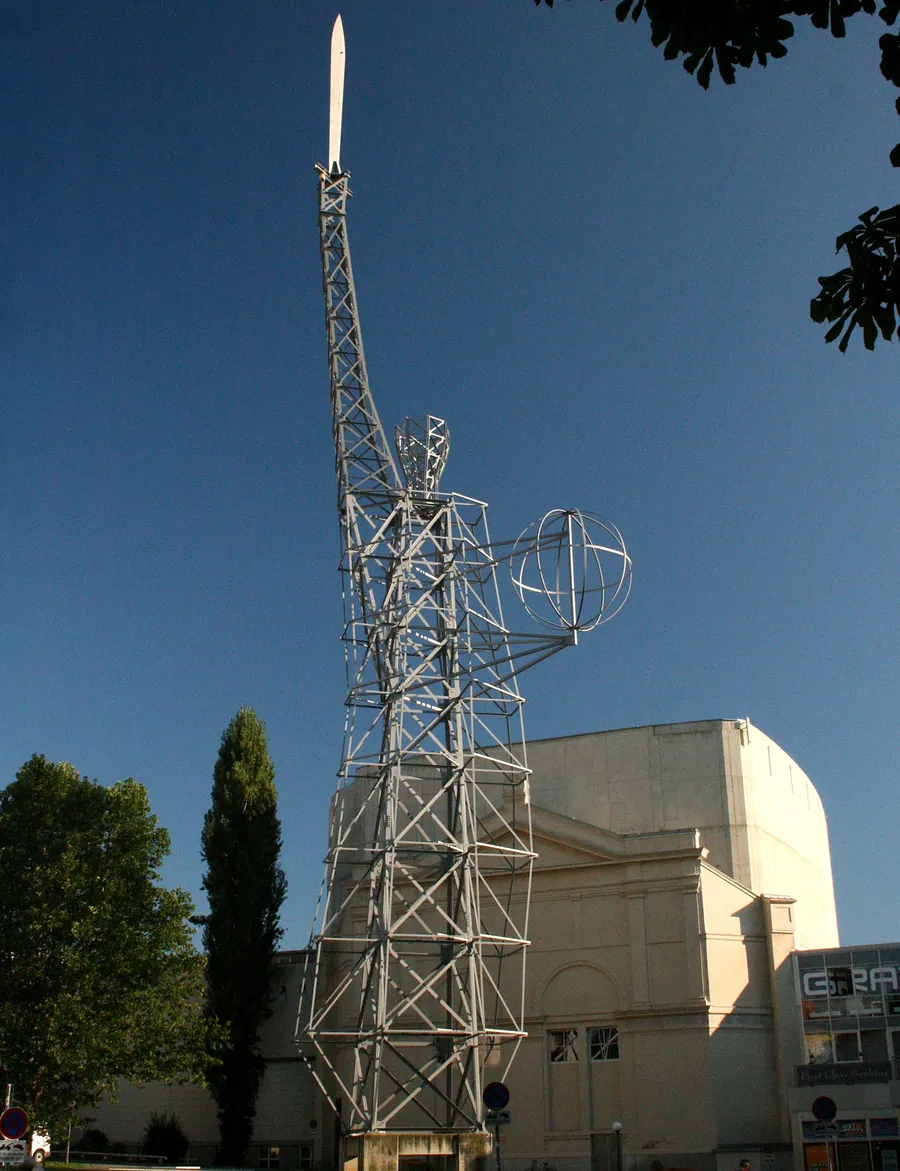
The Lichtschwert (“light sword”) by Hartmut Skerbisch, 1992, in front of the Graz opera house: a steel Statue of Liberty holding a sword and a globe. Cr3ate’s flight over the city ends here.
Image: Marion Schneider & Christoph Aistleitner, CC0, via Wikimedia Commons (resized, converted to WebP).At ARGO
City-scale 3D is the backdrop that location-based experiences have been missing. Wemap, ARGO’s parent company, maps cities, sites and buildings. ARGO builds the marketing and activation layer on top of them. What splats add is the photographic realism of a district, opened from a link or a QR code in the browser, with no app. We start where the value is: a district, a festival site, a development in its neighbourhood. The scene is streamed so that it opens on any phone, and completed from the ground wherever visitors will look up close.
FAQ
Frequently asked questions
Sources and further reading
- The scenes: Cr3ate, LinkedIn page (Graz, vendor figures) · Radiance Fields, Cr3ate profile · Cesium, 3D Gaussian splats with levels of detail · XGRIDS, Minning Town · Terrasolid, Tallinn workflow
- Capture: Vexcel, UltraCam Dragon and brochure · Vexcel, joining CoStar Group · Pix4D, Gaussian splatting in PIX4Dmatic
- Streaming: PlayCanvas, Streamed SOG and SuperSplat streaming · Spark, new features in 2.0 · Khronos, KHR_gaussian_splatting
- Research: Kerbl et al., Hierarchical 3D Gaussians · CityGaussian · BlitzGS
- Limits and law: Esri, splat layers · French government, ZICAD derogation · GDPR
- Uses: Ars Electronica, Beyond Curiosity
Figures and sources checked on 30 October 2026; file sizes and capture counts are estimates computed from them.