
Terrestrial and aerial Gaussian splatting: from a street to a city
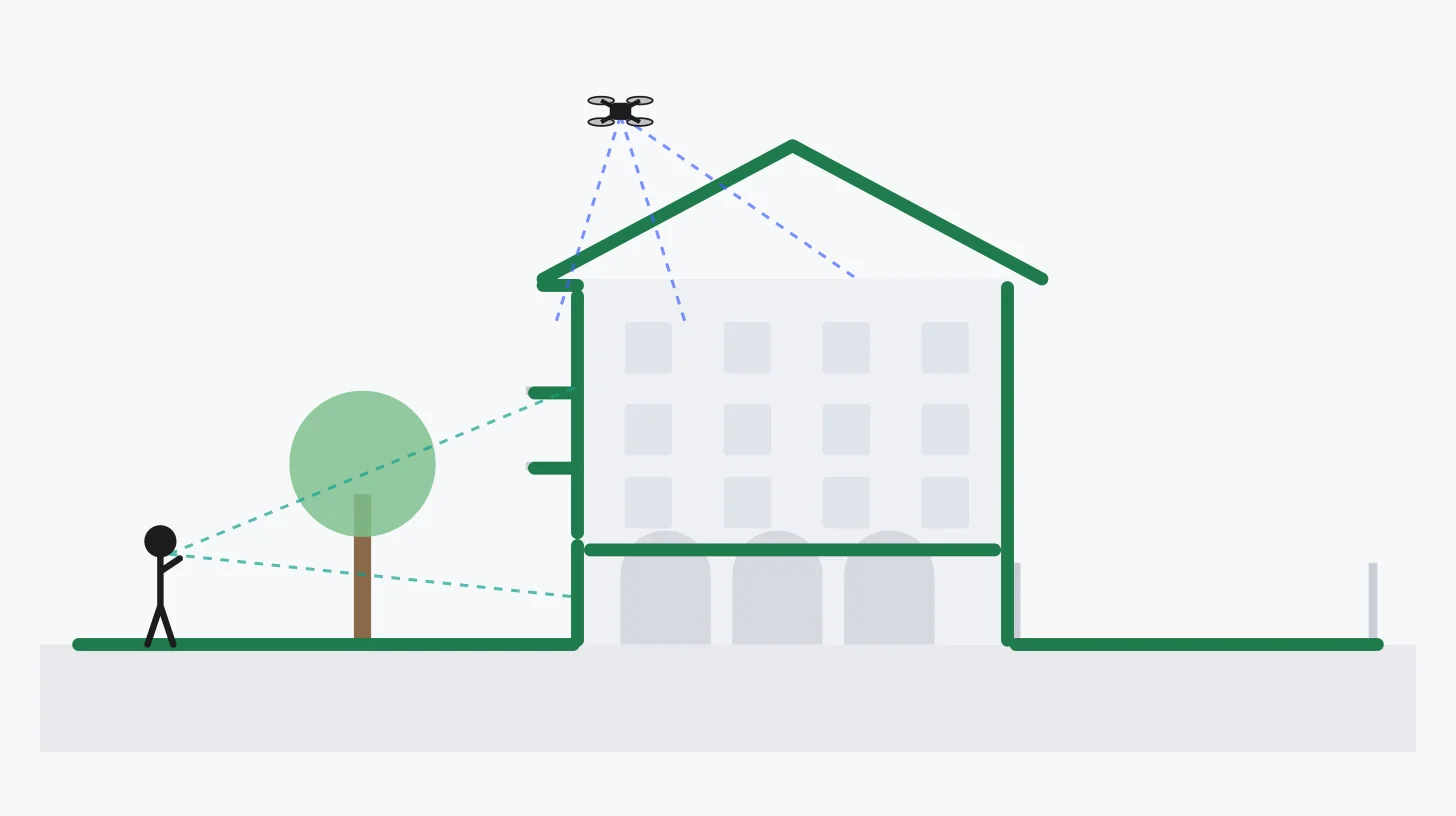
A splat of an object is a matter of turning around it. A splat of a street, a site or a district is a matter of where the cameras stand. From the air, a drone sees roofs and courtyards but grazes the façades; from the ground, a walker sees under the balconies and inside the arcades but never the roof. Each misses what the other sees — and the largest splats of 2026 combine both.
This part of the series leaves objects and rooms behind. The tools themselves — drones, scanners, 360 cameras — are compared in the previous part; here we look at what each viewpoint gives, how to plan a flight, and how splats now scale up to whole districts.
What each viewpoint sees
- Seen — Missed — Seen — Roof
- Seen — Grazing angle — Seen — Upper façade
- Missed — Seen — Seen — Under the eaves and balconies
- Grazing angle — Seen — Seen — Ground-floor façade
- Missed — Seen — Seen — Inside the arcade
- Seen — Seen — Seen — Street
- Seen — Missed — Seen — Rear façade
- Seen — Missed — Seen — Private courtyard
A building in cross-section — a street with a tree, a façade with balconies and a ground-floor arcade, a roof, a private courtyard behind — and, for a capture from the air, from the ground, or both, which surfaces are seen squarely, only at a grazing angle, or not at all.
A simplified model of a typical case, not a simulation: every building is different. But the pattern is general — what the air sees best, the ground sees worst, and the other way round.
From the air: drones, planes and satellites
The drone has become the standard tool for exteriors, and the mapping software now produces splats. DJI Terra does so since version 5.0 (July 2025), at about 500 images an hour and up to 30,000 images per job, exported in 3D Tiles or PLY. PIX4D followed, in the cloud since October 2025 and in PIX4Dmatic since May 2026, with georeferenced, measurable splats. Esri generates them in ArcGIS Reality since the end of 2025, from oblique aerial or drone images, and delivers them as 3D Tiles into its maps; Bentley does the same in iTwin Capture Modeler. Varjo Teleport goes furthest in automation: you draw an area on a map, an app flies the drone, and the cloud returns a scene of up to 100 million splats — its public demo covers a whole district of Tampere, in Finland.
DJI presenting Gaussian splatting in DJI Terra, in July 2025: drone photos turned into a splat of a whole site.
Video: DJI Enterprise, on YouTube.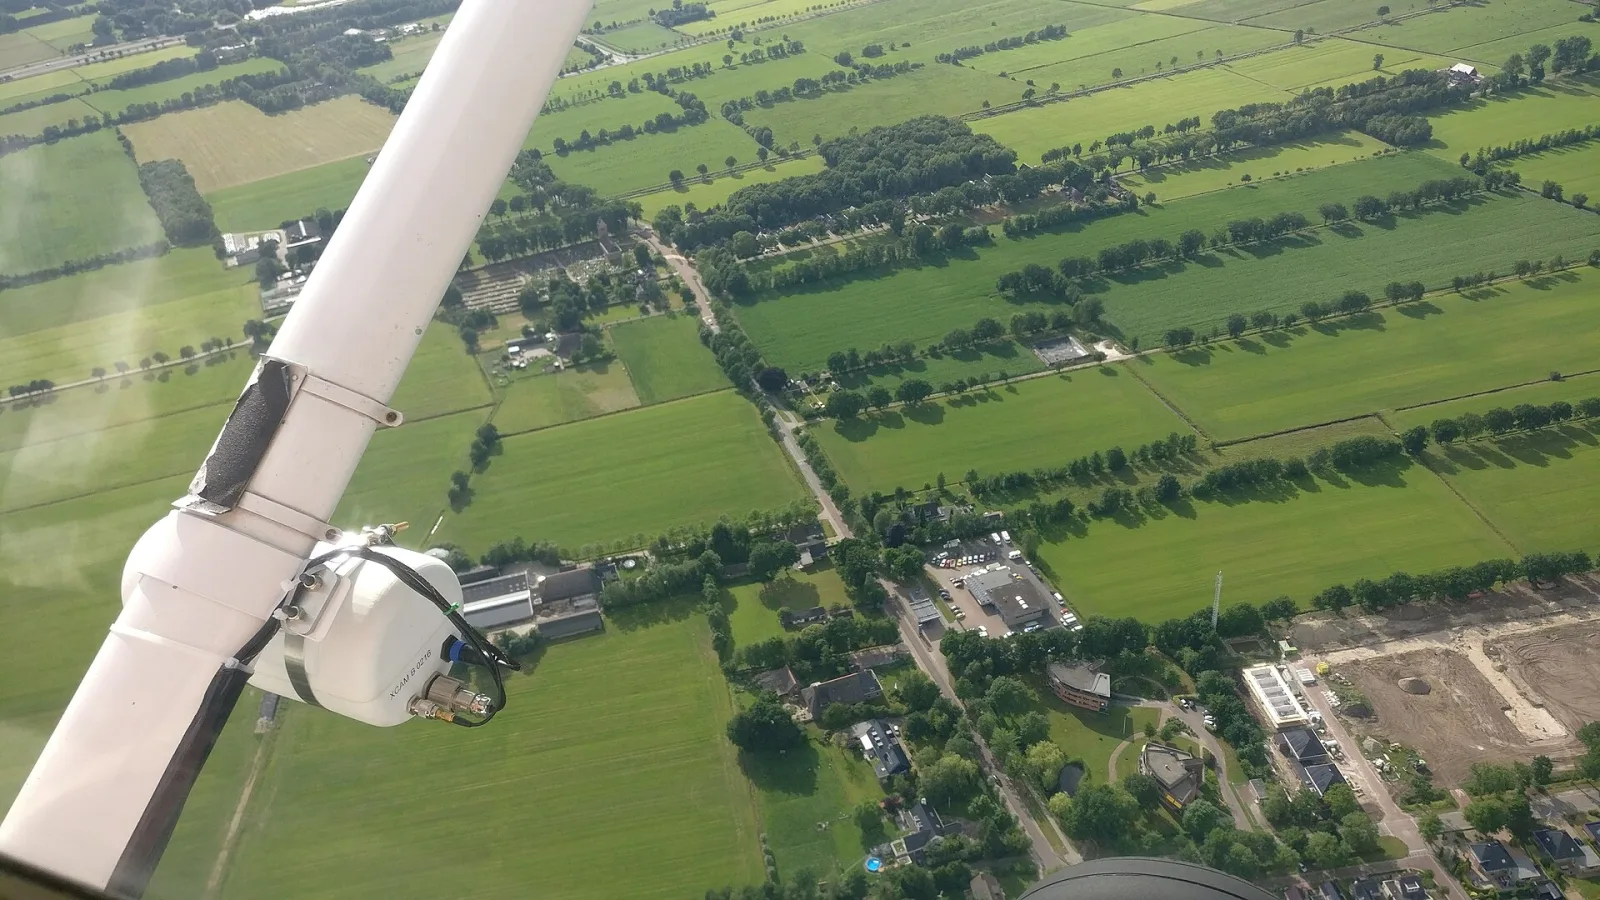
An aerial mapping camera fixed to the wing of a light aircraft: where a drone covers a site, a plane covers a whole city, from much higher up.
Image: Chrismewse, CC BY-SA 4.0, via Wikimedia Commons (resized, converted to WebP).Manned aircraft have joined in. Leica’s CityMapper-3, unveiled by Hexagon in January 2026 for city-wide aerial mapping, “supports emerging Gaussian splatting technology” — enough to earn it the nickname “City Splatter”. Satellites, on the other hand, remain a research topic: methods such as EOGS produce elevation models from satellite images with Gaussians, but Esri, for one, explicitly excludes satellite imagery from its splat pipeline.
Planning a flight comes down to a few numbers: the altitude sets the ground resolution — how many centimetres of ground each pixel covers — and, with the overlap between photos, how many pictures and how many minutes it takes.
Plan a drone capture
- Ground resolution
- 2.2 cm per pixel
- Footprint of a photo
- 114 × 85 m
- Photos, looking down
- ≈ 280
- With oblique views
- ≈ 970
- Flight
- ≈ 5 min · 1 battery
- Processing (DJI Terra)
- ≈ 1.9 h
Resolution from DJI’s own rule for this camera (altitude ÷ 37.2), 80 % forward and 70 % side overlap (DJI Terra’s defaults), oblique views ×3.5 as in DJI’s test, 15 m/s, 49 min batteries used to 70 %, processing at about 500 images an hour. Rough planning figures, not a flight plan.
A calculator: choose a drone, an altitude and an area, and read the ground resolution, the footprint of each photo, the number of photos without and with oblique views, the flight time and the processing time. A plan shows the area with its flight lines and two photo footprints to scale.
Two things stand out. Resolution follows altitude directly: halving the height halves the centimetres per pixel, but roughly quadruples the photos. And oblique views, indispensable for façades, cost three to four times as many photos as a flight looking straight down — in DJI’s own test, 3,011 photos instead of 856 for the same 16 hectares. In the European open category, the ceiling is 120 metres.
From the ground: on foot and on wheels
On foot, the tools are those of the previous part: a 360 camera, a handheld scanner, or several cameras worn at once. Inria’s researchers captured the districts of their Hierarchical 3D Gaussian study with six action cameras mounted on a bicycle helmet: 5,822 photos along 450 metres for the smallest, 38,235 along 7 kilometres for the largest.
Inria’s SIGGRAPH 2024 presentation: whole districts captured from the ground, cut into chunks and rendered with levels of detail.
Video: GraphDeco Inria Research Group, on YouTube.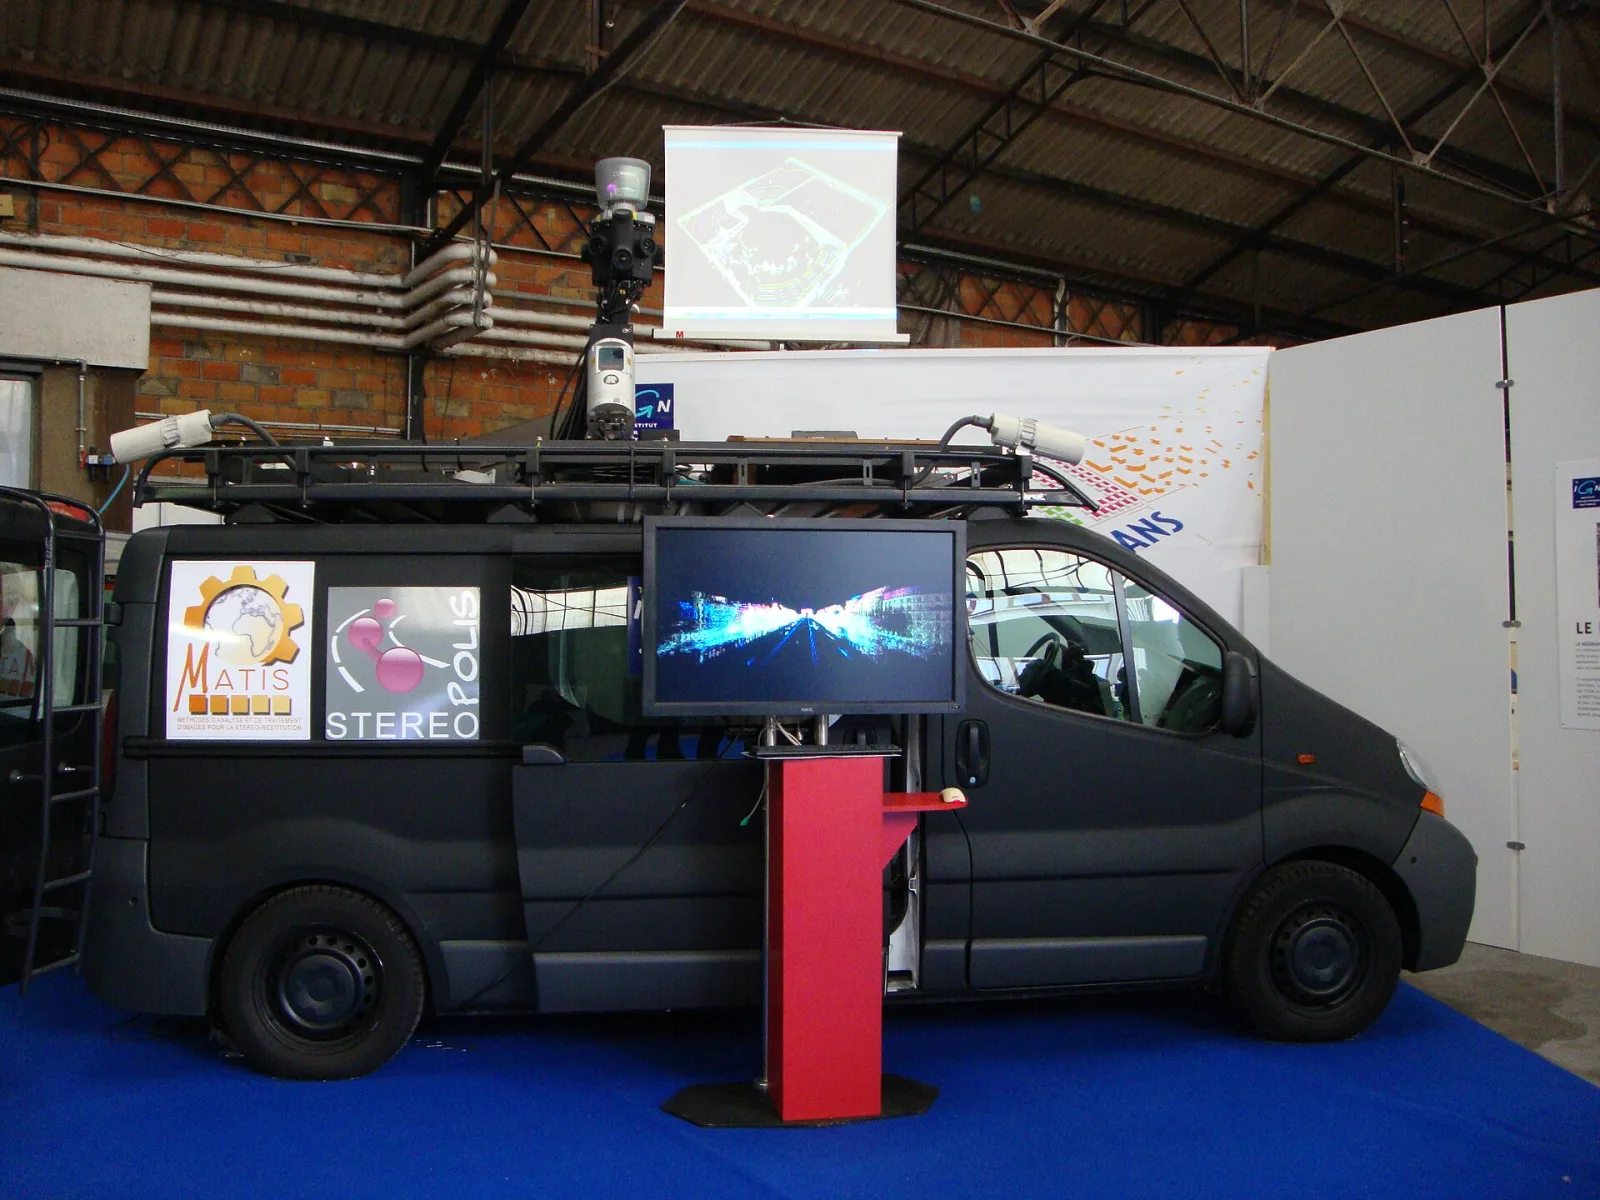
Stéréopolis, the French national mapping agency IGN’s street-mapping vehicle: cameras and a laser scanner on the roof record the street as the van drives.
Image: Lomita, CC BY-SA 3.0, via Wikimedia Commons (resized, converted to WebP).On wheels, mobile mapping is getting there too. Mosaic turns the 360° images of its vehicle-mounted cameras into splats, from a single block to thousands of kilometres of road. And the self-driving car industry has made street splats a simulation tool: NVIDIA’s Omniverse NuRec rebuilds real streets from vehicle camera footage to test driving software, splitting each scene into layers — background, road, vehicles, pedestrians — and treating the sky apart.
Air and ground together
Merging the two is harder than it sounds. The views are so different — a roof from 80 metres up, a doorway from 1.5 metres — that the software which locates photos by matching details often fails to link them: researchers have gone as far as generating intermediate views to bridge the gap.
In practice, the answer is a common reference frame. XGRIDS’ fusion workflow requires satellite positioning with RTK on both captures, the scanner on the ground and the drone in the air, and has the drone climb in “towers” of photos from the ground up to its mapping altitude before flying its grid — so that some aerial photos resemble the ground ones.
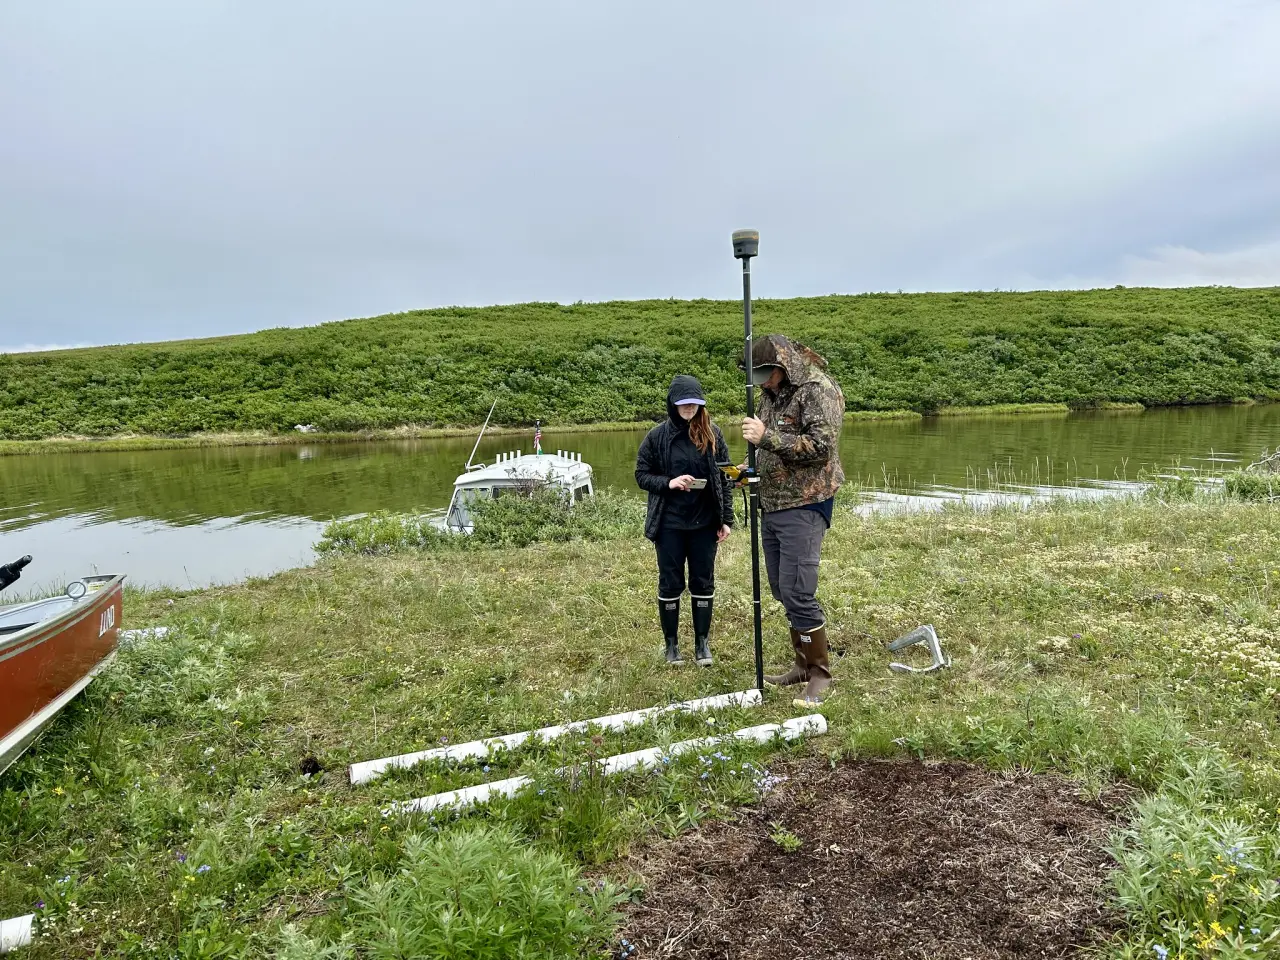
Placing ground control for a structure-from-motion survey in Cape Krusenstern National Monument, Alaska: points measured precisely on the ground tie every capture — aerial or terrestrial — to the same coordinates.
Image: NPS Photo / Annie Carlson, CC BY 2.0, via Flickr (resized, converted to WebP).XGRIDS showing a drone capture and a handheld scan merged into one model, inside and out.
Video: XGRIDS, on YouTube.A heritage example: the Ryhope Engines Museum, in England, captured inside and out with a handheld scanner and a DJI Matrice 4E, then merged into a single splat.
Georeferenced, tiled, streamed
A splat of a district is useless if it cannot be placed on a map or opened on a screen. Three developments of 2026 changed that.
A standard format. The glTF extension KHR_gaussian_splatting, drafted with Cesium, Esri, Bentley, NVIDIA and XGRIDS among others, is now ratified; the OGC, the body behind geospatial standards, has opened work on 3D Tiles 2.0, which lists Gaussian splats among its new content types.
Levels of detail. Since April 2026, Cesium cuts splats into 3D Tiles with levels of detail, like the tiles of a map: the Microsoft campus in Redmond, 110 million splats over 3.7 km², opens in a browser because only what is visible, at the useful resolution, is loaded. For comparison, Google’s Photorealistic 3D Tiles, which cover more than 2,500 cities, are still photogrammetric meshes, not splats.
A budget. Even streamed, a scene must fit in a device: World Labs estimates that most consumer devices render one to five million splats at an interactive frame rate, and sets its budget per frame between 500,000 and 2.5 million depending on the device.
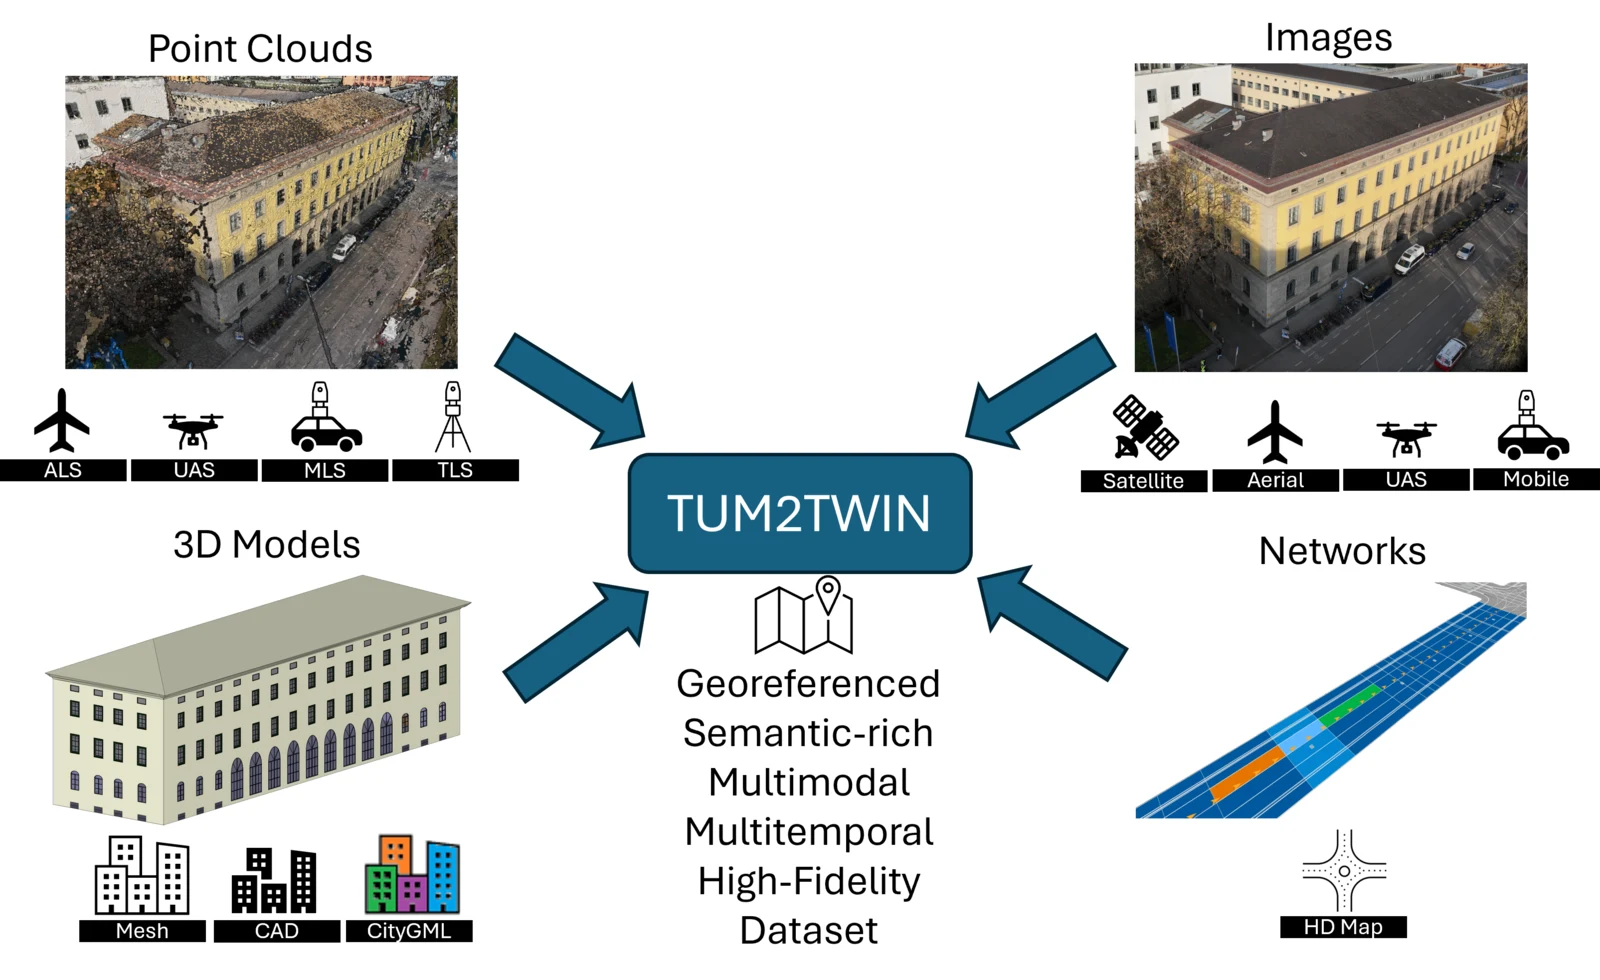
What a real urban digital twin combines, in the Technical University of Munich’s TUM2TWIN project: point clouds and images from aircraft, drones, vehicles and the ground, 3D building models and road maps — all in the same coordinates.
Image: Wysocki et al., “TUM2TWIN: Introducing the Large-Scale Multimodal Urban Digital Twin Benchmark Dataset”, CC BY 4.0, via arXiv:2505.07396 (figure 1, background made white, converted to WebP).From a camera body to a campus
- Camera model — the 3D model baked in part 3 of this series: about 15 × 9 cm, 200 renders, 43,192 Gaussians.
- Potted cactus — our CC0 test scene: about 0.1 m² (our estimate), 427 photos, 139,410 Gaussians.
- A room — about 100 m² covered in ten minutes by XGRIDS’ Lixel L3 scanner, according to its manufacturer.
- Small town district — 40,000 m² along a 450 m path, 5,822 photos from six cameras on a bike helmet (Inria, Hierarchical 3DGS).
- Large city district — 530,000 m² along 7 km, 38,235 photos, 88 GB of data (same study).
- Synthetic city — 2.7 km² of the MatrixCity virtual city, 23.7 million Gaussians (CityGaussian).
- Microsoft campus — 3.7 km² in Redmond, 20,169 drone photos at 3 cm per pixel, 110 million splats streamed in 3D Tiles (Cesium and Bentley).
A logarithmic scale of area, from one square centimetre to ten square kilometres, with seven real Gaussian splatting captures placed on it: a baked camera model, a potted cactus, a room, two city districts captured on foot, a synthetic city and a real campus.
Seven captures over nearly eight orders of magnitude of area. Beyond a few hundred square metres, a splat is no longer a file but a tiled, streamed dataset.
There is also a less visible pitfall: numerical precision. Graphics cards compute in 32-bit numbers, which, in coordinates centred on the Earth, cannot place a point more finely than a few tens of centimetres — about 0.25 m according to Cesium. Geospatial viewers therefore store each tile relative to a local origin, which is why georeferenced splats come in dedicated formats rather than a raw PLY.
The problems of big outdoor scenes
- The sky. Infinitely far and without texture, it fills with floaters. The Inria study surrounds its scenes with a “skybox” of 100,000 Gaussians on a sphere ten times their size; NVIDIA models the sky separately, as an image around the scene.
- Everything that moves. Cars, cyclists, passers-by appear in some photos and not in others. Large-scale pipelines detect and remove them automatically — the Inria study removes people and licence plates too, which also matters for privacy.
- Light that changes. A capture of several hours sees the sun move and clouds pass. The trainers correct the exposure photo by photo, or learn an “appearance” per image that is discarded afterwards.
- Weight. Tens of millions of splats, hundreds of gigabytes of photos: large scenes are trained in chunks, sometimes on several graphics cards, and delivered as streamed tiles.
What it is used for
- Urban planning and GIS. In ArcGIS, a splat of a site becomes a map layer, overlaid with parcels, building models and zoning.
- Construction and infrastructure. Georeferenced, measurable splats follow a site’s progress, or document a substation or a bridge.
- Heritage. Varjo captured the interior of London’s Guildhall with 4,000 to 5,000 drone photos; the Ars Electronica Futurelab used splatting to rebuild the surroundings of Notre-Dame de Paris for an immersive projection.
- Simulation. Streets rebuilt as splats train robots and self-driving cars on real places.
- Tourism and entertainment. A captured district can be flown over, walked through, or turned into a game setting.
At ARGO
For a brand, a site rarely needs to be measured to the centimetre; it needs to be recognised and explored. A splat of a shop front, a venue or a destination, captured from the air and the ground, then compressed and streamed, opens on the visitor’s phone from a QR code on a poster or an invitation — the place itself, in the browser, with no app.
FAQ
Frequently asked questions
Sources and further reading
- Aerial software: Heliguy, DJI Terra and Gaussian splatting · DJI, DJI Terra FAQ · PIX4D, Gaussian splatting in PIX4Dmatic · Esri, Generate Gaussian splats with ArcGIS Reality · Varjo Teleport Autopilot · Geo Week News, Hexagon at Geo Week 2026
- Flight planning: DJI, Mavic 3 Multispectral FAQ (ground resolution) · Matrice 4 specifications · Mini 5 Pro specifications · DJI, Matrice 4E accuracy test · Pix4D, image acquisition · EASA, height limit
- Research: Kerbl et al., A Hierarchical 3D Gaussian Representation for Real-Time Rendering of Very Large Datasets, SIGGRAPH 2024 — arXiv:2406.12080 · Liu et al., CityGaussian, arXiv:2404.01133 · Lin et al., VastGaussian, arXiv:2402.17427 · EOGS, arXiv:2412.13047 · DRAGON, arXiv:2407.01761
- Ground and fusion: Mosaic city-scale reconstruction · NVIDIA, NuRec best practices · XGRIDS aerial-ground fusion workflow
- Standards and streaming: Cesium, 3D Gaussian splats with levels of detail · Khronos, KHR_gaussian_splatting · OGC, 3D Tiles 2.0 work item · World Labs, Spark 2.0 · Cesium, Geospatial guide (precision)
Products, figures and rules checked on 30 September 2026.